
Selebi Mine
Resource
Area
Deposit Type
Accessibility
Botswana:
A Tier-One Mining Jurisdiction
Recognized globally for its political stability and mining-friendly policies, Botswana offers a supportive environment for resource development. Government initiatives are actively encouraging mining investment as a means of generating long-term employment and economic growth.
Resource Growth Underway
NexMetals Mining Corp. completed an NI 43-101 Mineral Resource Estimate (MRE), effective June 30, 2024, for the Selebi Main and Selebi North deposits, confirming that these deposits are significantly larger than previously understood.
A targeted 2025 drill campaign is now underway to fast-track the delineation of scale.
Operational Advantages
Permitted & Proven
Built-in Advantage
Exploration Upside
Capital Efficiency
Technology Under Evaluation
Local Team in Place
Established Mining Community
Selebi North & Selebi Main
Initial Focus
Advancing Selebi North through underground drilling and testing the 2 km gap between Selebi North and Selebi Main through surface drilling.
- Surface drilling program targeting BHEM plates in the untested 2 km long area between the Selebi North and Selebi Main deposits referred to as the hinge.
BHEM Targeting
The BHEM targets are situated down-plunge and down-dip of the Selebi Main resource and potentially indicate additional mineralization between the two deposits.
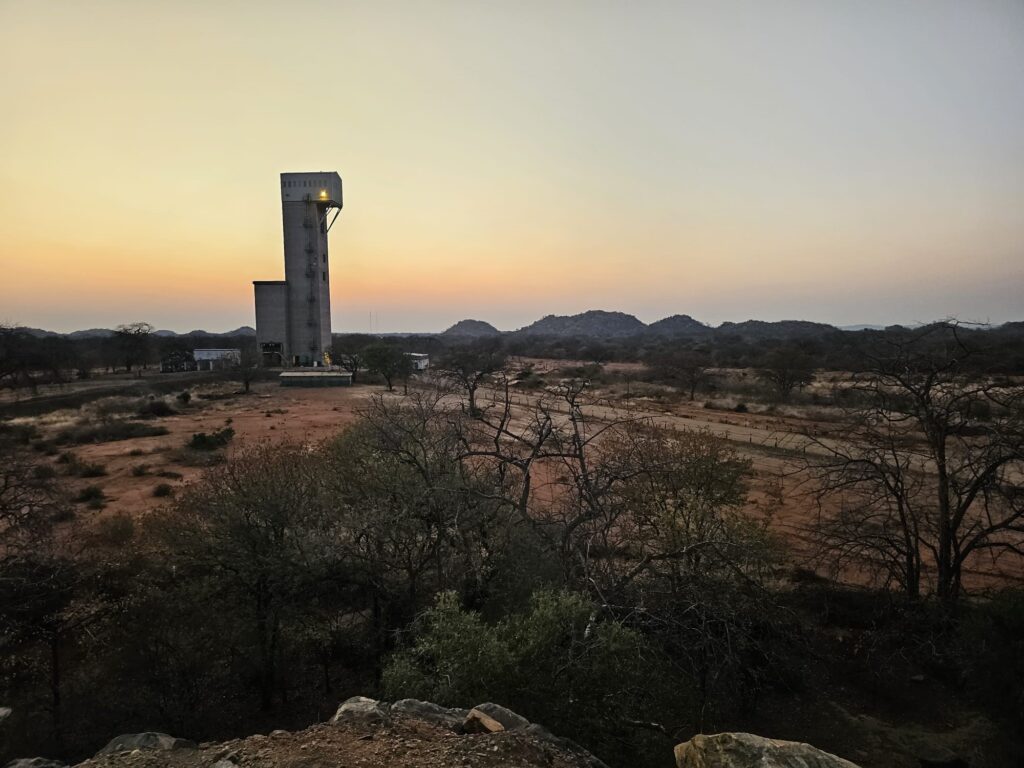
Selebi Shaft Quick Facts
- Opened in 1980, operational for 36 years
- In total, 26.6 million tonnes (Mt) grading 0.58% Ni and 1.03% Cu was mined from Selebi (1980 to 2016)
- Development Depth 1140m
- Currently on care and maintenance
Selebi North Shaft Quick Facts
- Mine production began in 1990. Shaft commissioned in 1998. Operational for 26 years
- In total, 13.9 Mt grading 0.74% Ni and 0.66% Cu was mined from Selebi North (1990 to 2016)
- Development Depth 970m
- Currently on care and maintenance
Technical Reports
NI 43-101 Summary
Selebi Main Deposit
- Inferred MRE: 18.89 Mt at 3.51% CuEq or 1.70% NiEq.
Selebi North Deposit
- Indicated MRE: 3.00 Mt at 2.92% CuEq or 1.42% NiEq.
- Inferred MRE: 5.83 Mt at 3.11% CuEq or 1.51% NiEq.
This initial estimate reaffirms our confidence in the potential for continued resource growth at Selebi.
Classification
Deposit
Tonnage Mt
Cu %
Ni %
Cu kt
Ni kt
Indicated
Selebi North
3.0
0.90
0.98
27
29
Inferred
Selebi Main
18.9
1.69
0.88
319
165
Selebi North
5.8
0.90
1.07
52
62
Total Inferred
24.7
1.50
0.92
371
227
*Notes: 1. CIM (2014) definitions were followed for mineral resources. | 2. Mineral resources are estimated at a NSR value of $70/t. | 3. Mineral resources are estimated using long-term prices of US$10.50/lb Ni and US$4.75/lb Cu and a US$: BWP exchange rate of 1.00:13.23. | 4. Mineral resources are estimated using nickel and copper recoveries of 72.0% and 92.4% respectively, derived from metallurgical studies which consider a conceptual bulk concentrate scenario. | 5. Bulk density has been estimated and averages 3.39 t/m3 at Selebi Main and 3.60 t/m3 at Selebi North. | 6. Mineral resources are reported within conceptual underground reporting shapes considering a minimum thickness of 1.5 metres. | 7. There are no mineral reserves. | 8. Mineral resources that are not mineral reserves do not have demonstrated economic viability. | 9. Totals may not add or multiply accurately due to rounding.