
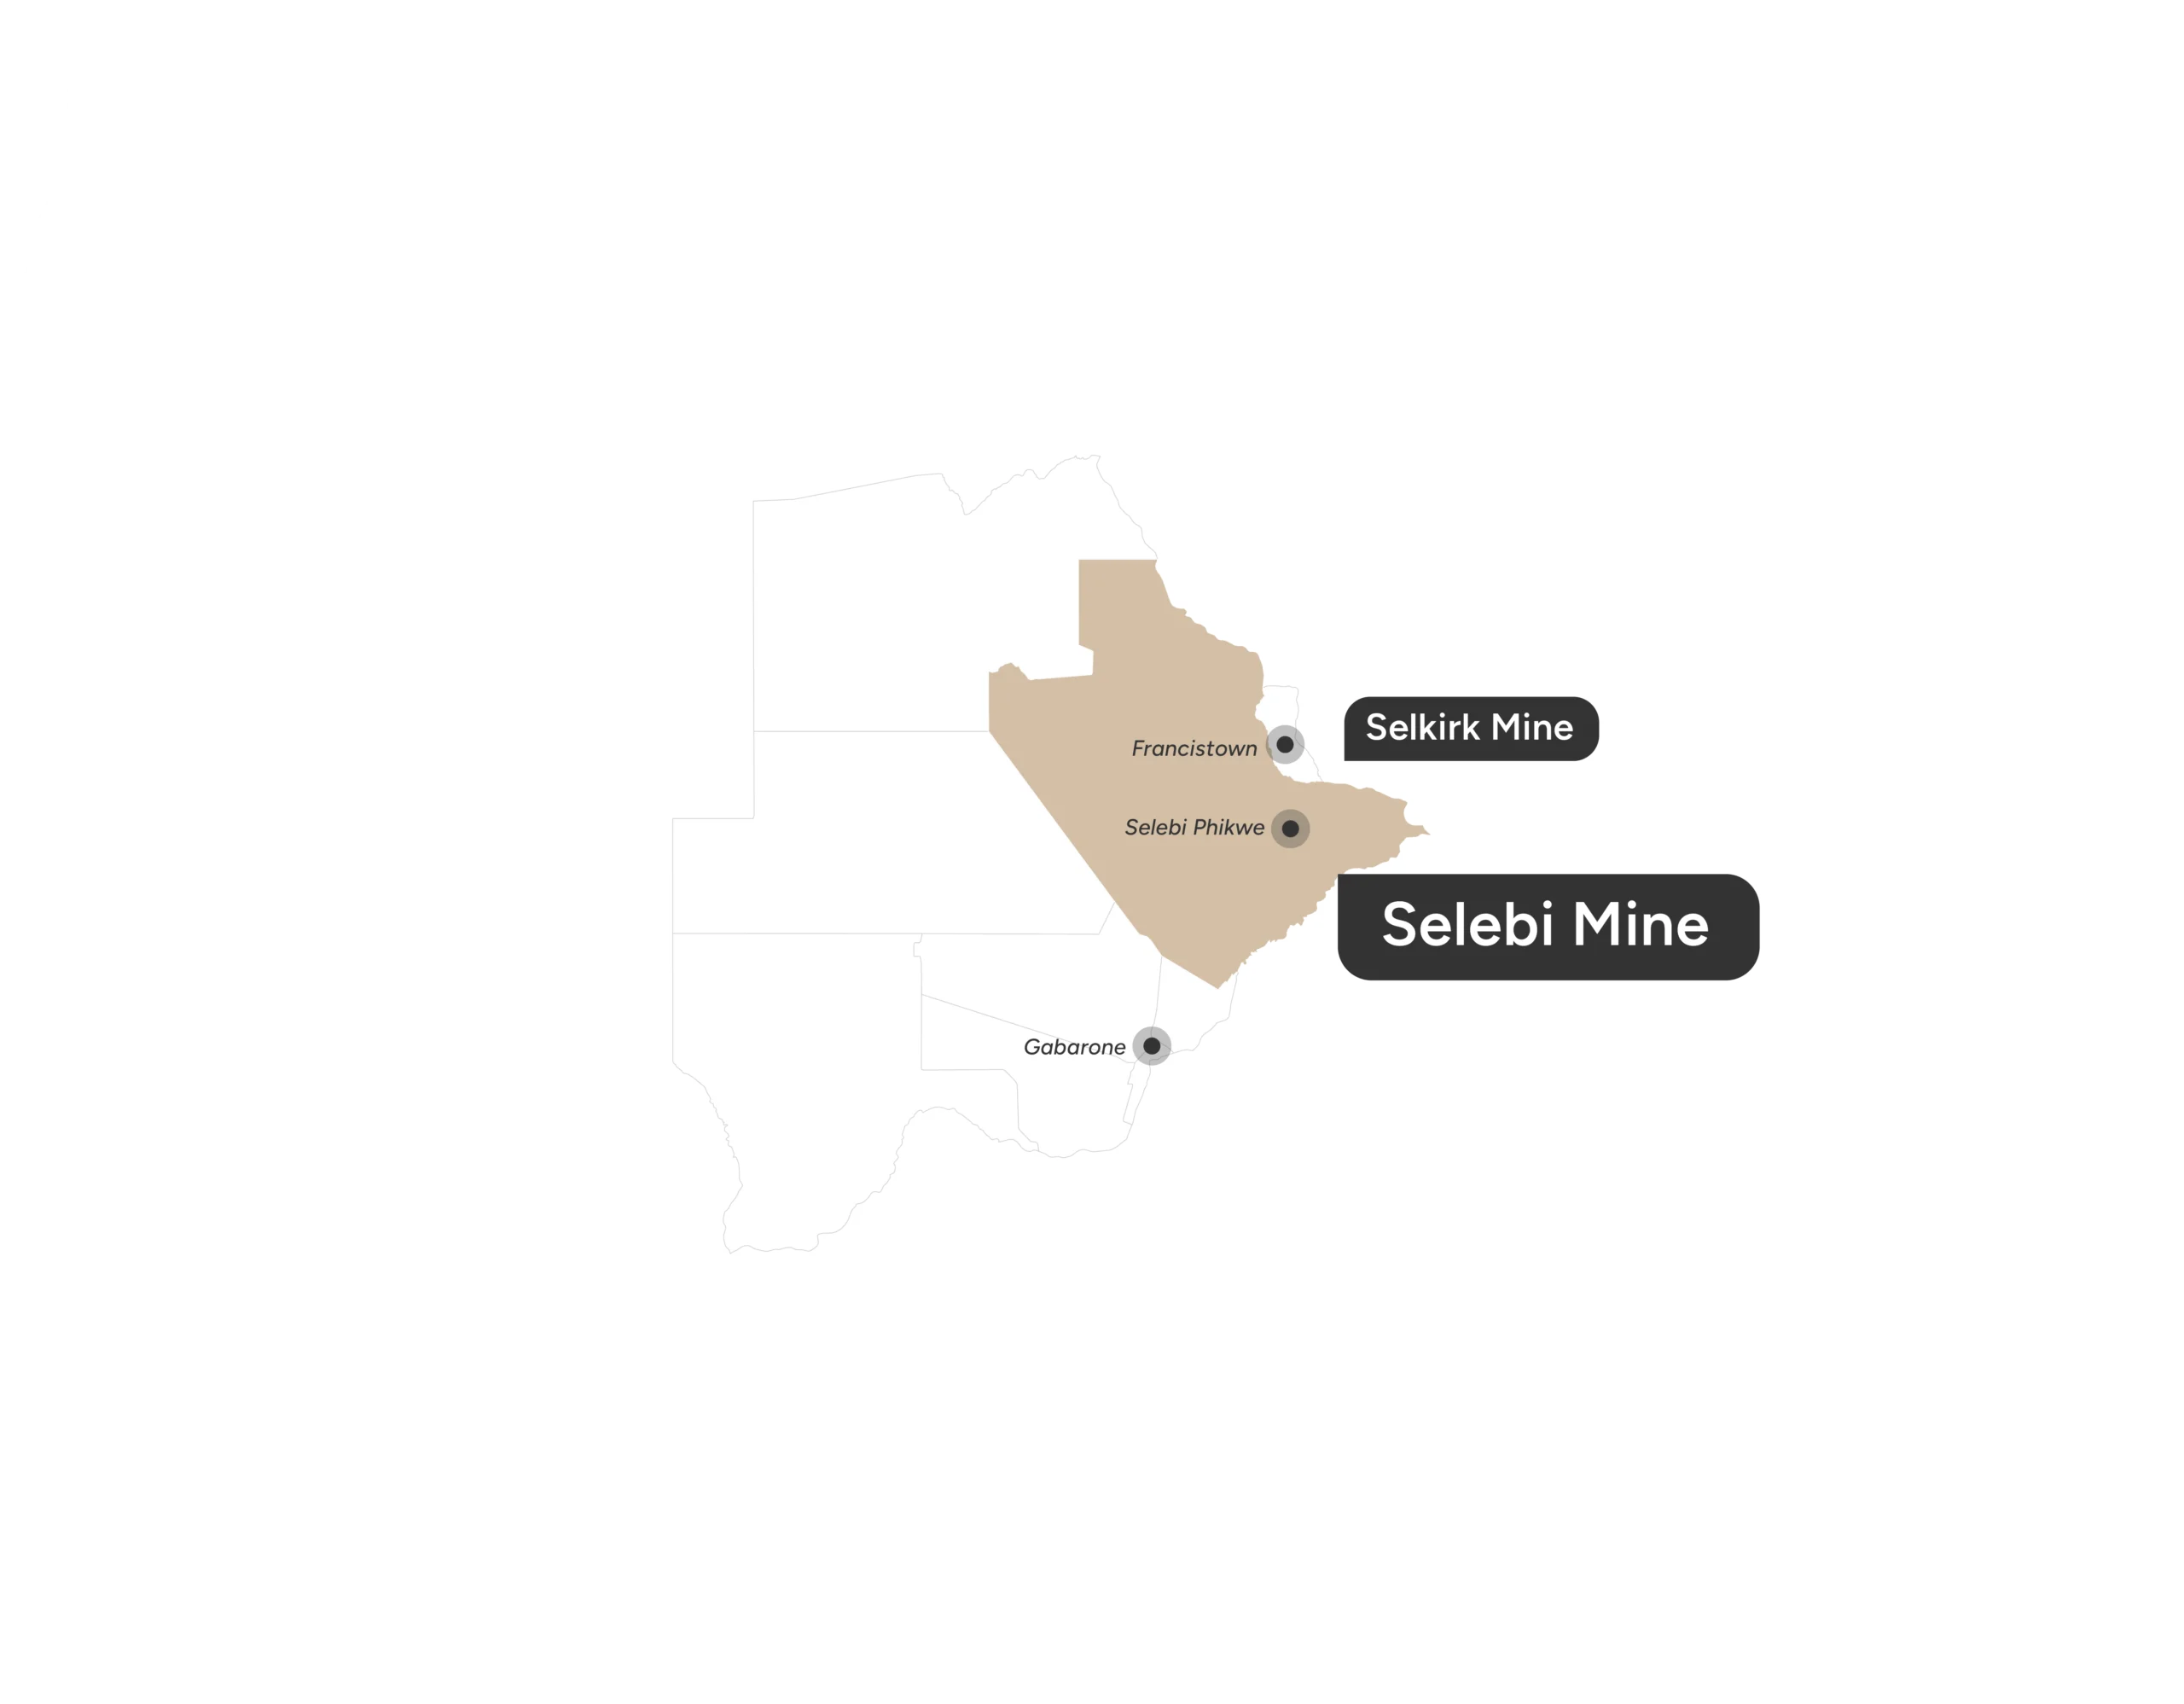
Selebi Mine
LOCATION:
OWNERSHIP:
DEPOSIT TYPE:
STAGE:
PRIMARY METALS:
Highlights

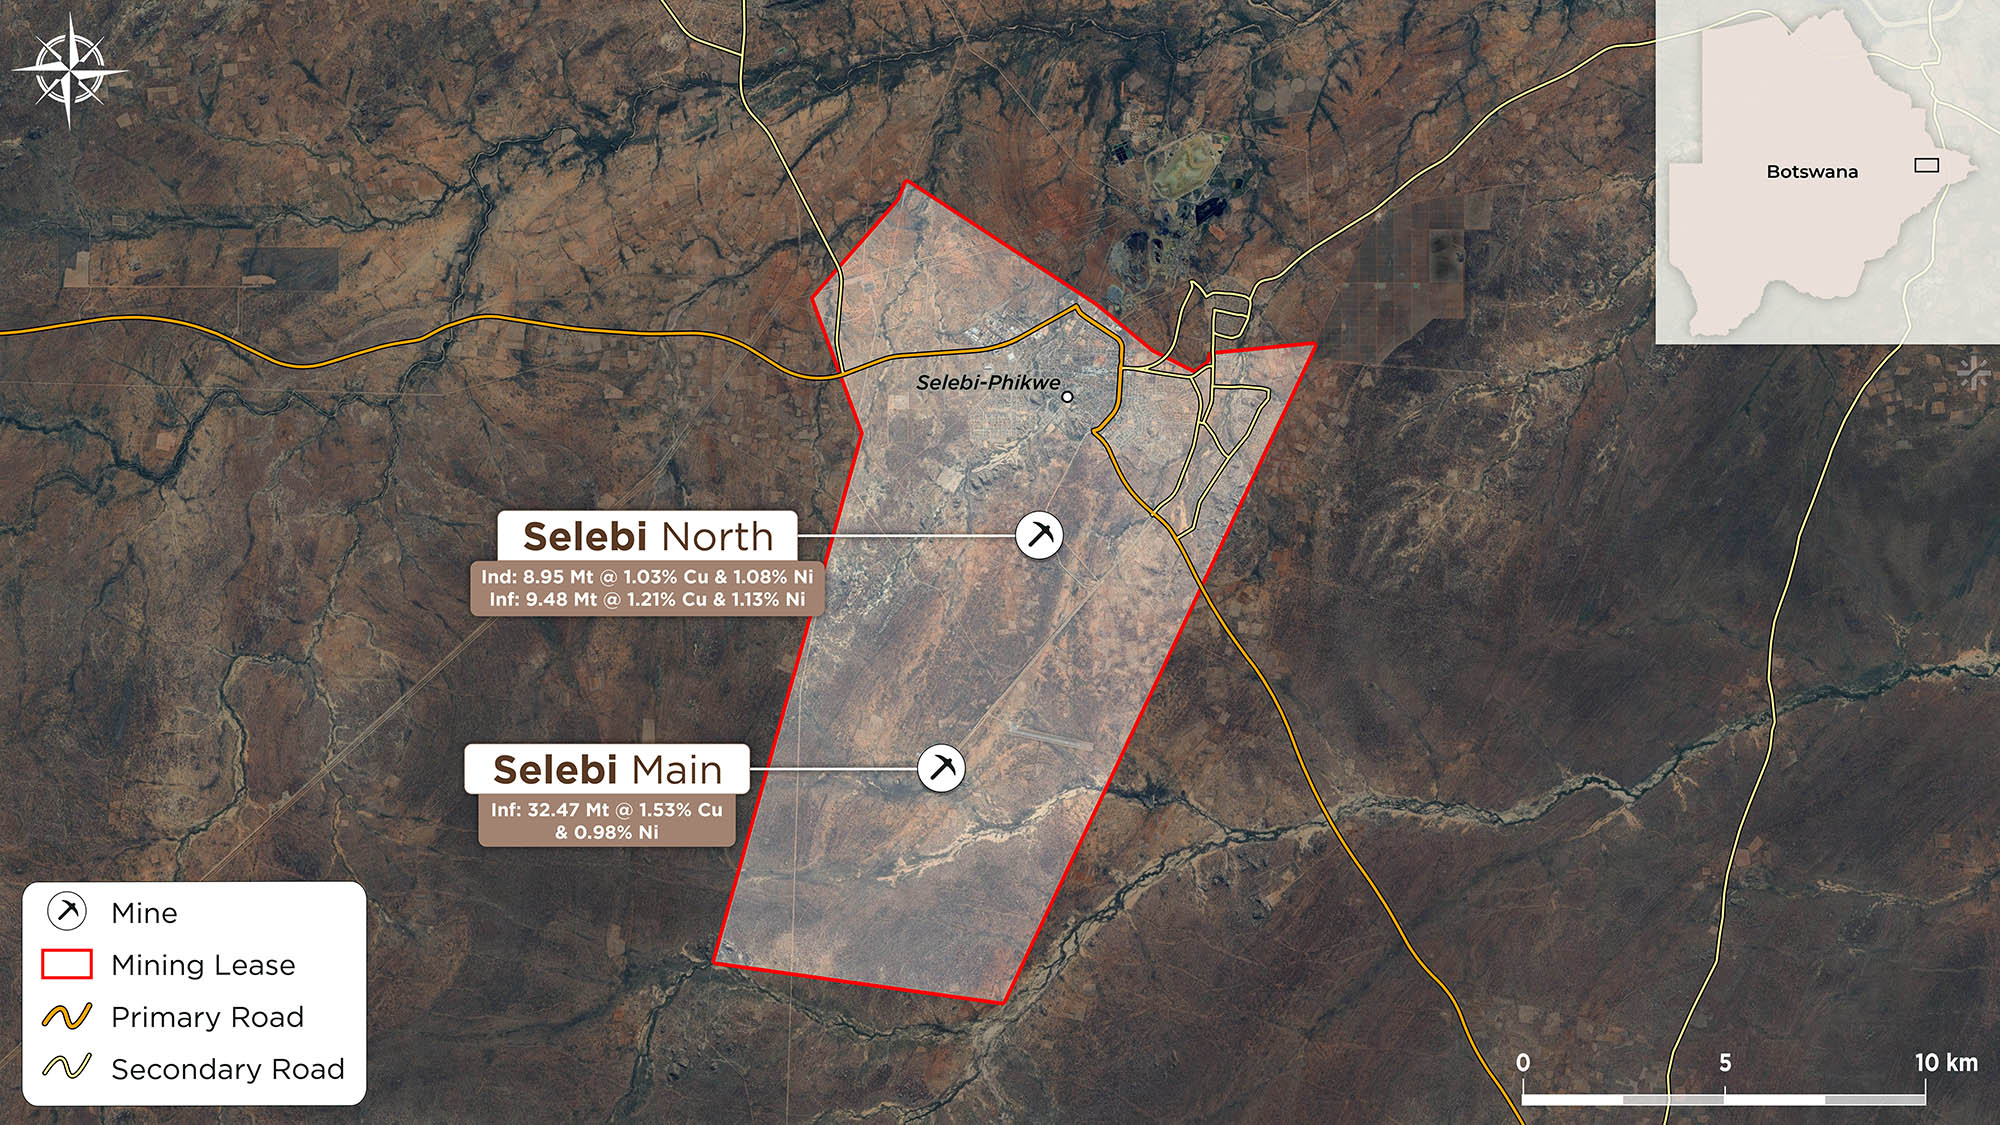
UPDATED NI 43-101 MINERAL RESOURCE ESTIMATE ON THE SELEBI MINES
Selebi Main Notes:
- All tabulated data have been rounded and as a result minor computational errors may occur.
- Mineral Resources, which are not Mineral Reserves, have no demonstrated economic viability. There is no guarantee that that all or any part of the Mineral Resource will be converted into a Mineral Reserve. The estimate of Mineral Resources may be materially affected by geology, environment, permitting, legal title, taxation, socio-political, marketing, or other relevant issues.
- kt = thousand tonnes, Mt = Million tonnes Mlbs = Million pounds
- The 2026 MRE has been prepared in accordance with the CIM Definition Standards (2014) and CIM Best Practice Guidelines (2019) with a data cut-off of September 21, 2026, and an effective date of September 28, 2026.
- Mineral Resources are reported at a cut-off value of US$75/t NSR (Net Smelter Return) defined as received value of final metal recovered minus off-site costs, and a minimum thickness of 1.5 metre.
- Mineral Resources are estimated using long-term prices of US$9.10/lb Ni, US$5.10/lb Cu, US$20.00/lb Co. The same metal prices were used in NSR calculations.
- Mineral Resources are estimated using nickel, copper and cobalt recoveries of 55.6%, 96.1%, and 60.2%, respectively, derived from metallurgical studies which consider a two-concentrate scenario.
- Payabilities and off-site treatment and refining costs were derived from an independent marketing study commissioned by NexMetals.
- Bulk density has been estimated in the block model based on an extensive data set of measurements taken from drillhole cores. The average density is 3.51 t/m3 for the Upper vein and 3.38 t/m3 for Lower vein.
- Mineral Resources are reported using NSR values, mining cost of US$47.60, concentrate processing costs of US$20.00/tonne and G&A of US$5.50/tonne.
- Areas depleted or sterilized by mining were removed from the mineral resource as well as an interpreted dyke.
- There are no Mineral Reserves.
- Copper equivalent is calculated using the formula CuEq =(Cu%*96.4+Ni%*87.0+Co%*132.7)/96.4.
Selebi North notes:
- All tabulated data have been rounded and as a result minor computational errors may occur.
- Mineral Resources, which are not Mineral Reserves, have no demonstrated economic viability. There is no guarantee that all or any part of the Mineral Resource will be converted into a Mineral Reserve. The estimate of Mineral Resources may be materially affected by geology, environment, permitting, legal title, taxation, socio-political, marketing, or other relevant issues.
- Mt = Million tonnes, Mlbs = million pounds, CuEq = copper equivalent
- The 2026 MRE has been prepared in accordance with the CIM Definition Standards (2014) and CIM Best Practice Guidelines (2019) with an effective date of October 16, 2026.
- Mineral Resources are reported at a cut-off value of US$75/t NSR (Net Smelter Return), defined as received value of final metal recovered minus off-site costs, and a minimum thickness of 1.5 metres. Block model estimates of less than US$75/t NSR are included within the Mineral Resource in areas where it was considered not feasible to mine selectively around them. Areas of the block model were excluded in low grade areas where there is no potential to define a mineable block above US$75/t NSR.
- Mineral Resources are estimated using long-term prices of US$9.10/lb Ni, US$5.10/lb Cu, US$20.00/lb Co. The same metal prices were used in NSR calculations.
- Mineral Resources are estimated using nickel, copper and cobalt recoveries of 55.6%, 96.1%, and 60.2%, respectively, derived from metallurgical studies which consider a two-concentrate scenario.
- Payabilities and off-site treatment and refining costs were derived from an independent marketing study commissioned by NexMetals.
- Bulk density has been estimated in the block model based on an extensive data set of measurements taken from drillhole cores. The average density is 3.63 t/m3 for the mineralized zone.
- Mineral Resources are reported using NSR values which assume mining costs of US$47.60/tonne, concentrate processing costs of US$20.00/tonne and G&A of US$5.50/tonne.
- Areas depleted or sterilized by mining were removed from the mineral resource.
- There are no Mineral Reserves.
- Copper equivalent is calculated using the formula CuEq =(Cu%*96.4+Ni%*87.0+Co%*132.7)/96.4.
Geology
The deposits in the Project area are categorized as ortho-magmatic Cu-Ni sulphide-type deposits. They are hosted within amphibolite and understood as a tectono-metamorphically modified tholeiitic magma parent with an immiscible sulphide melt which has undergone all the phases of deformation that have affected the enclosing gneisses. They form part of the Selebi-Phikwe belt of intrusions that also contain the Phikwe, Dikoloti, Lentswe, and Phokoje deposits.
All mineralization horizons pinch and swell, are conformable to the gneissic foliation, and are hosted within or at the hanging wall contact of amphibolite with the gneissic country rocks. Mineralization horizons range in thickness from very thin to over 20 m thick and are commonly one metre to three metres thick (deposit dependent). Orientation follows country rock foliation, and the zones can dip moderately to steeply, and can extend from 150 m to over 2,000 m. The principal sulphide minerals are pyrrhotite, chalcopyrite, and pentlandite which occur in massive, semi-massive, and disseminated form. Pyrite occurs as localized overgrowth. Magnetite occurs as rounded inclusions in massive sulphides and as later overgrowths.
Exploration Potential
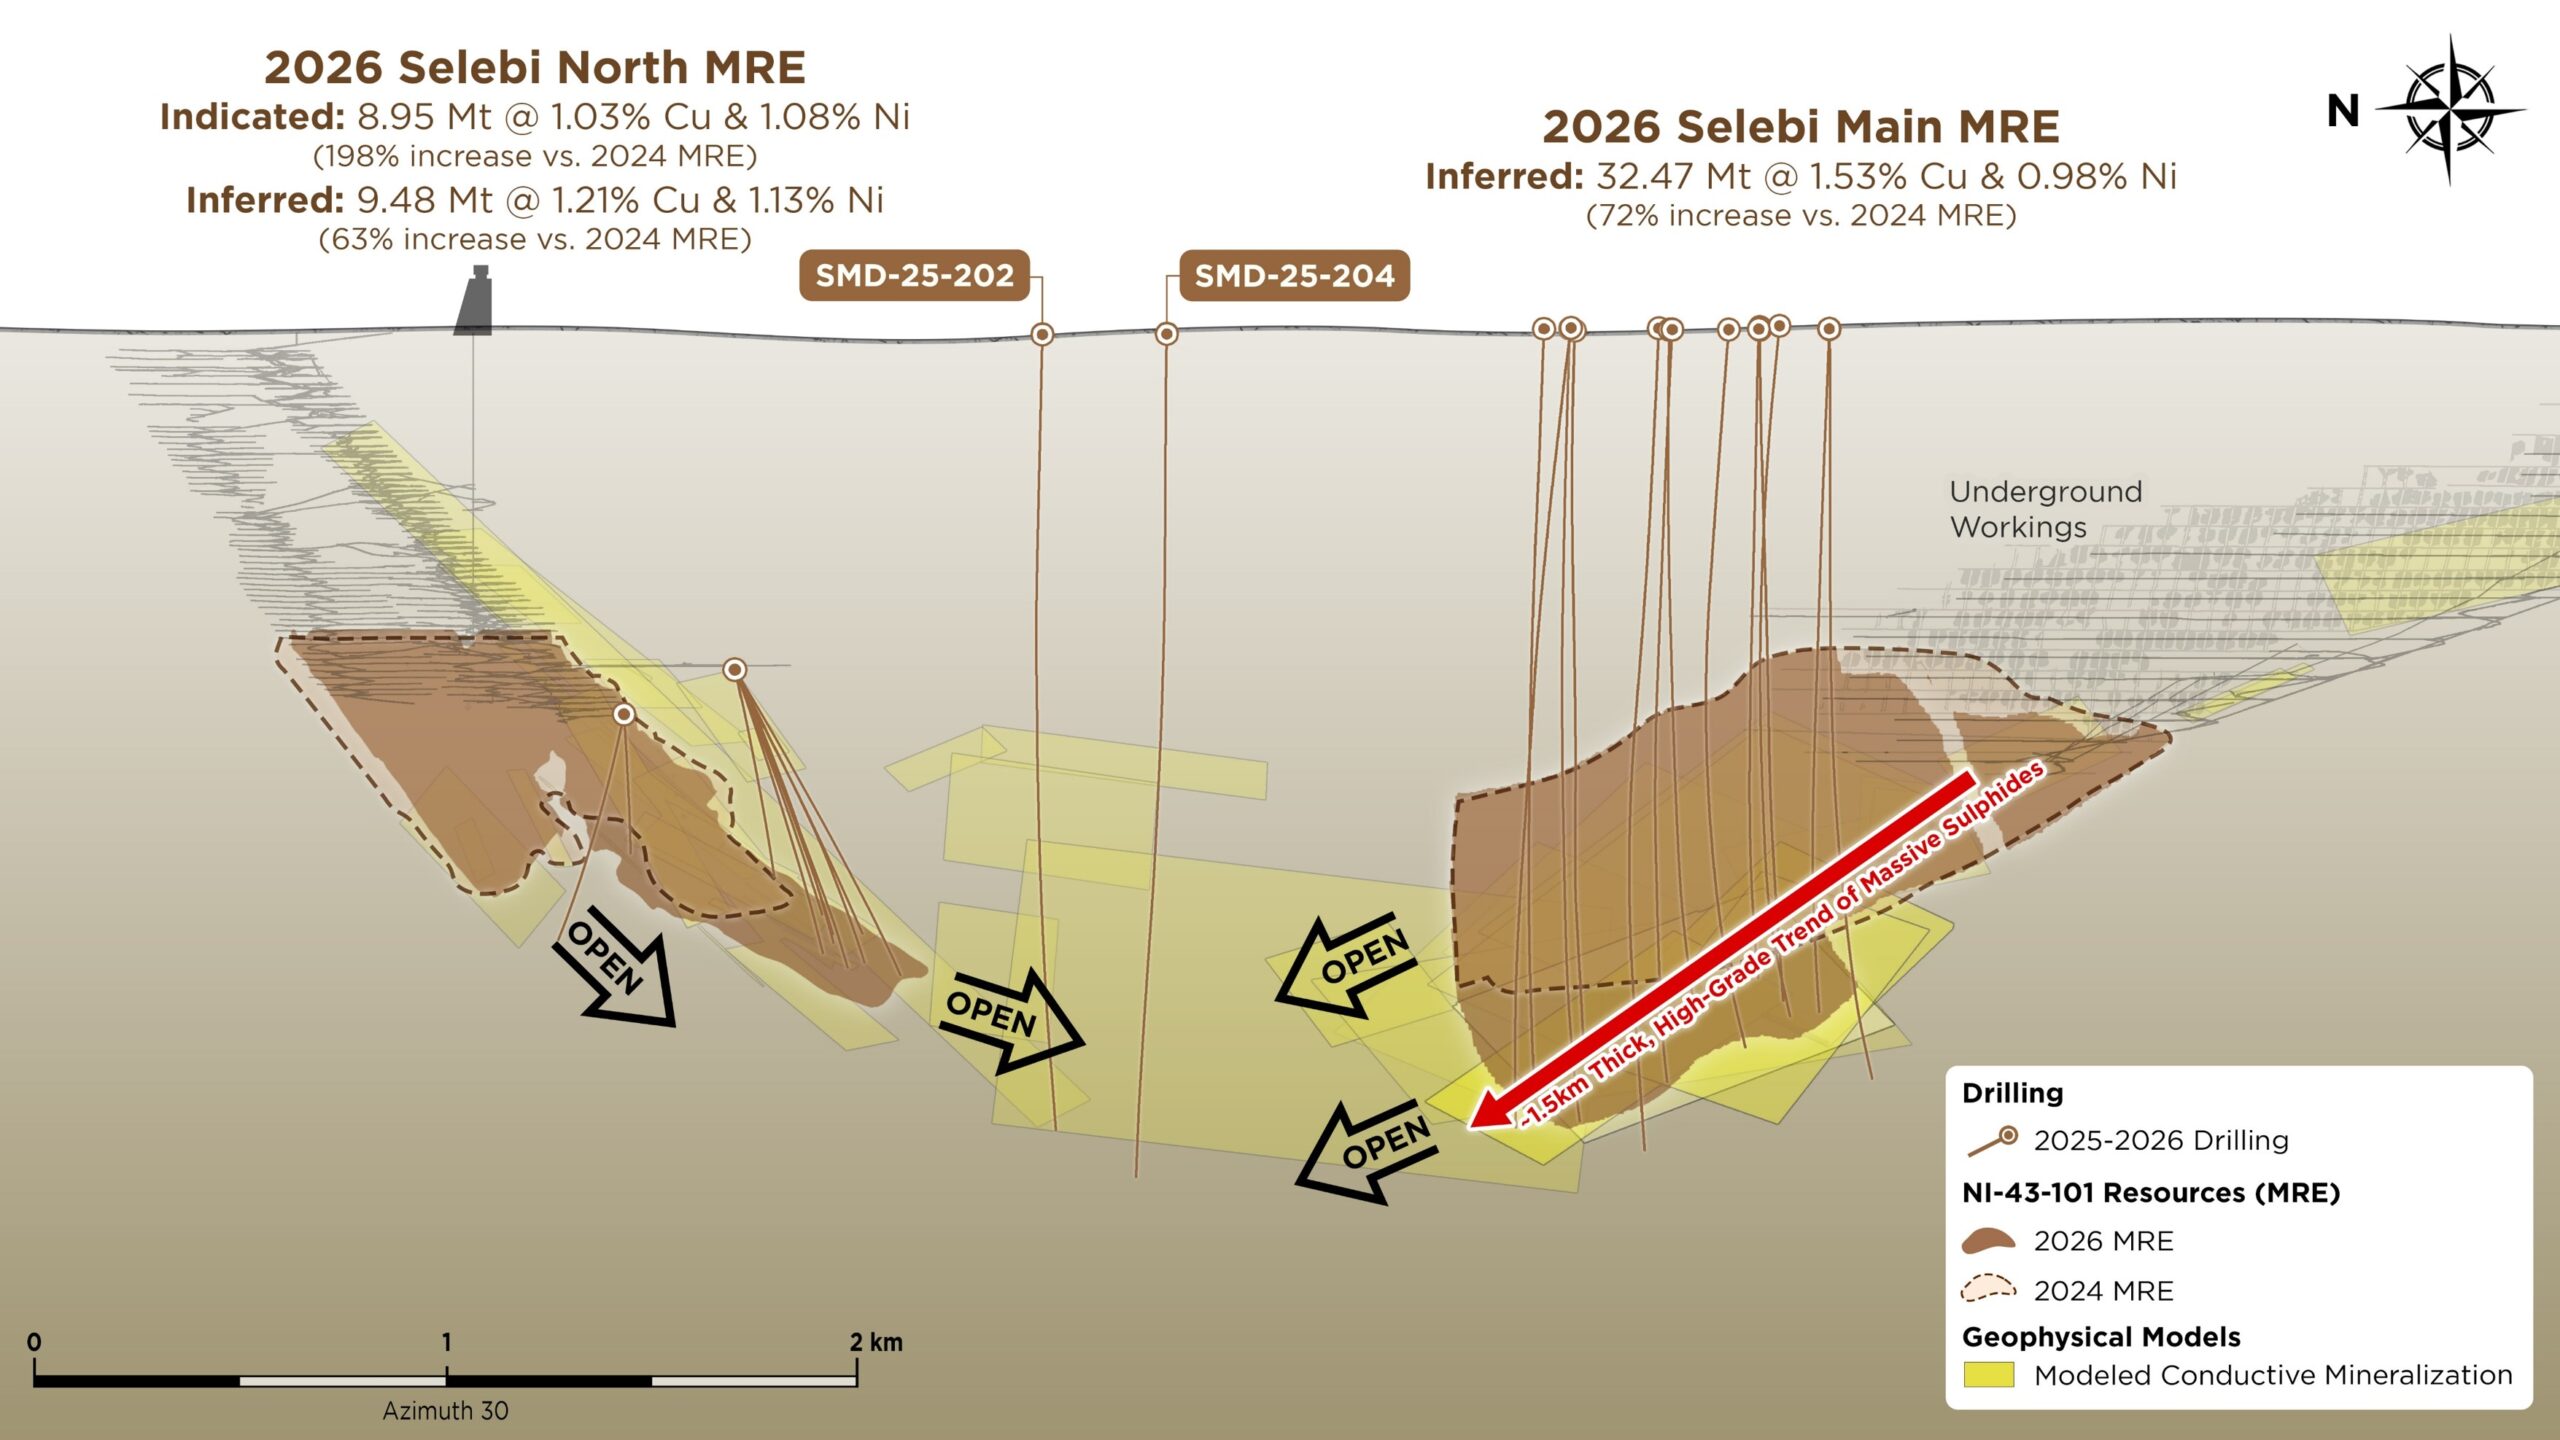
In 2026, the Company advanced resource expansion at the Selebi Mines, delivering updated Mineral Resource Estimates for both deposits. At Selebi Main, tonnage increased by approximately 72% compared with the Company’s 2024 Mineral Resource Estimate, to 32.47 million tonnes grading 1.53% copper and 0.98% nickel in the Inferred category, with approximately 91% of the increase attributable to new drilling in the Flexure Zone. At Selebi North, Indicated Mineral Resources nearly tripled to 8.95 million tonnes grading 1.03% copper and 1.08% nickel, and Inferred Mineral Resources increased 63% to 9.48 million tonnes grading 1.21% copper and 1.13% nickel. Both deposits remain open, with Selebi North’s South Limb turning toward Selebi Main at depth.
Following the acquisition of Selebi Mines in January 2022, the Company began an exploration program to follow up on these results, completing a 15,074 metre drilling program focused on the down-dip edge of the historical Selebi resource. More than 40 historical drill holes were reopened and surveyed using BHEM, with results consistently indicating increasing conductivity down-dip and supporting the interpretation that the mineralized system remained open at depth and was much larger than previously defined by drilling.
Desktop reviews of the BCL assets in liquidation began in December 2019 and an Indicative Offer was submitted in June 2020. Following its selection as the preferred bidder in February 2021, the Company completed comprehensive due diligence, including the evaluation of drilling and resource data, and inspection of mining and processing infrastructure. New BHEM survey data were collected in historical drill holes and samples were sent for concept level metallurgical studies. The primary objectives of the due diligence work was to determine the potential size and extent of the remaining mineral resource beyond the historical mine workings, and determine if saleable copper and nickel concentrates could be produced with reasonable recoveries.
Of great interest was historical drill hole sd119, that intersected 38.5 m grading 1.58% Ni and 2.44% Cu, including 21.4 m grading 2.34% Ni and 3.39% Cu, located approximately 300 m beyond existing mine workings and 1,200 m below. BHEM
surveying by BCL in hole sd140, drilled down-dip of sd119, identified a strong off-hole conductor that indicated a large conductor associated with this intersection.